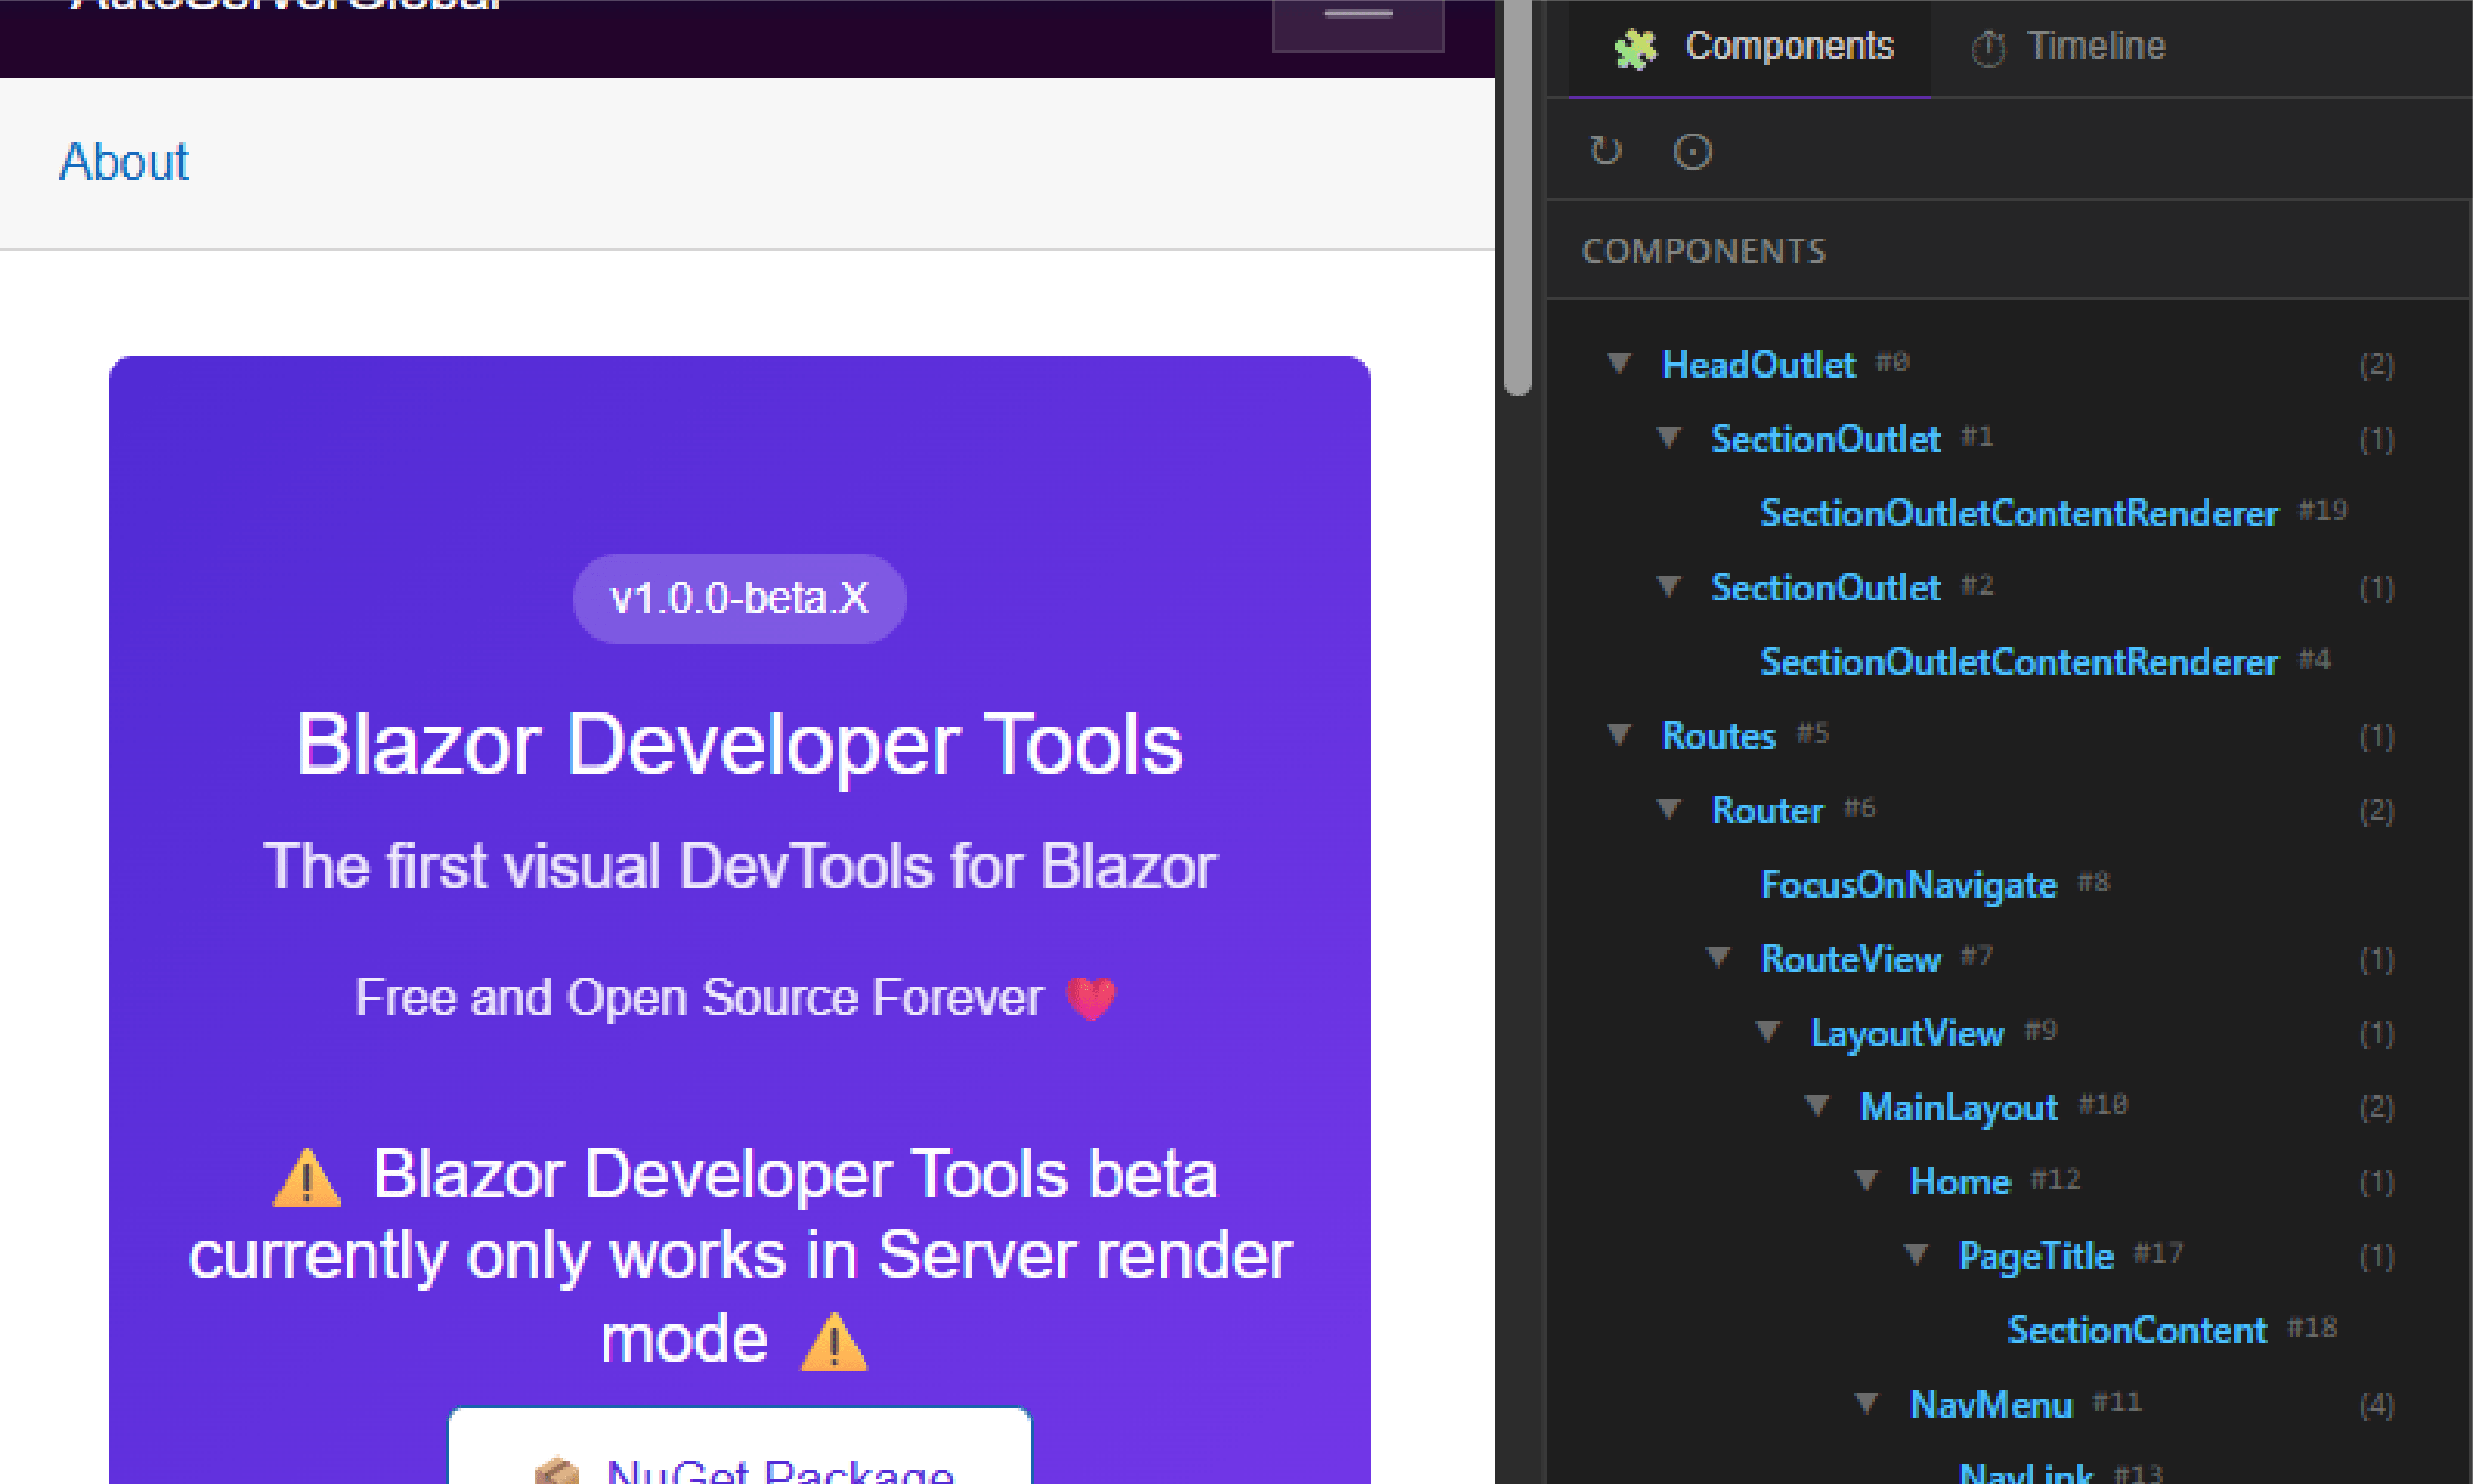
Blazor Developer Tools
The first visual DevTools for Blazor
Free and Open Source Forever ❤️
⚠️ Blazor Developer Tools beta currently only works in Auto Server render mode ⚠️
Install the browser extension, open DevTools (F12) on this very page and navigate to the Blazor tab to see Blazor Developer Tools in action!
What's New in v1.0.0-beta.x
A complete architectural rewrite with powerful new features
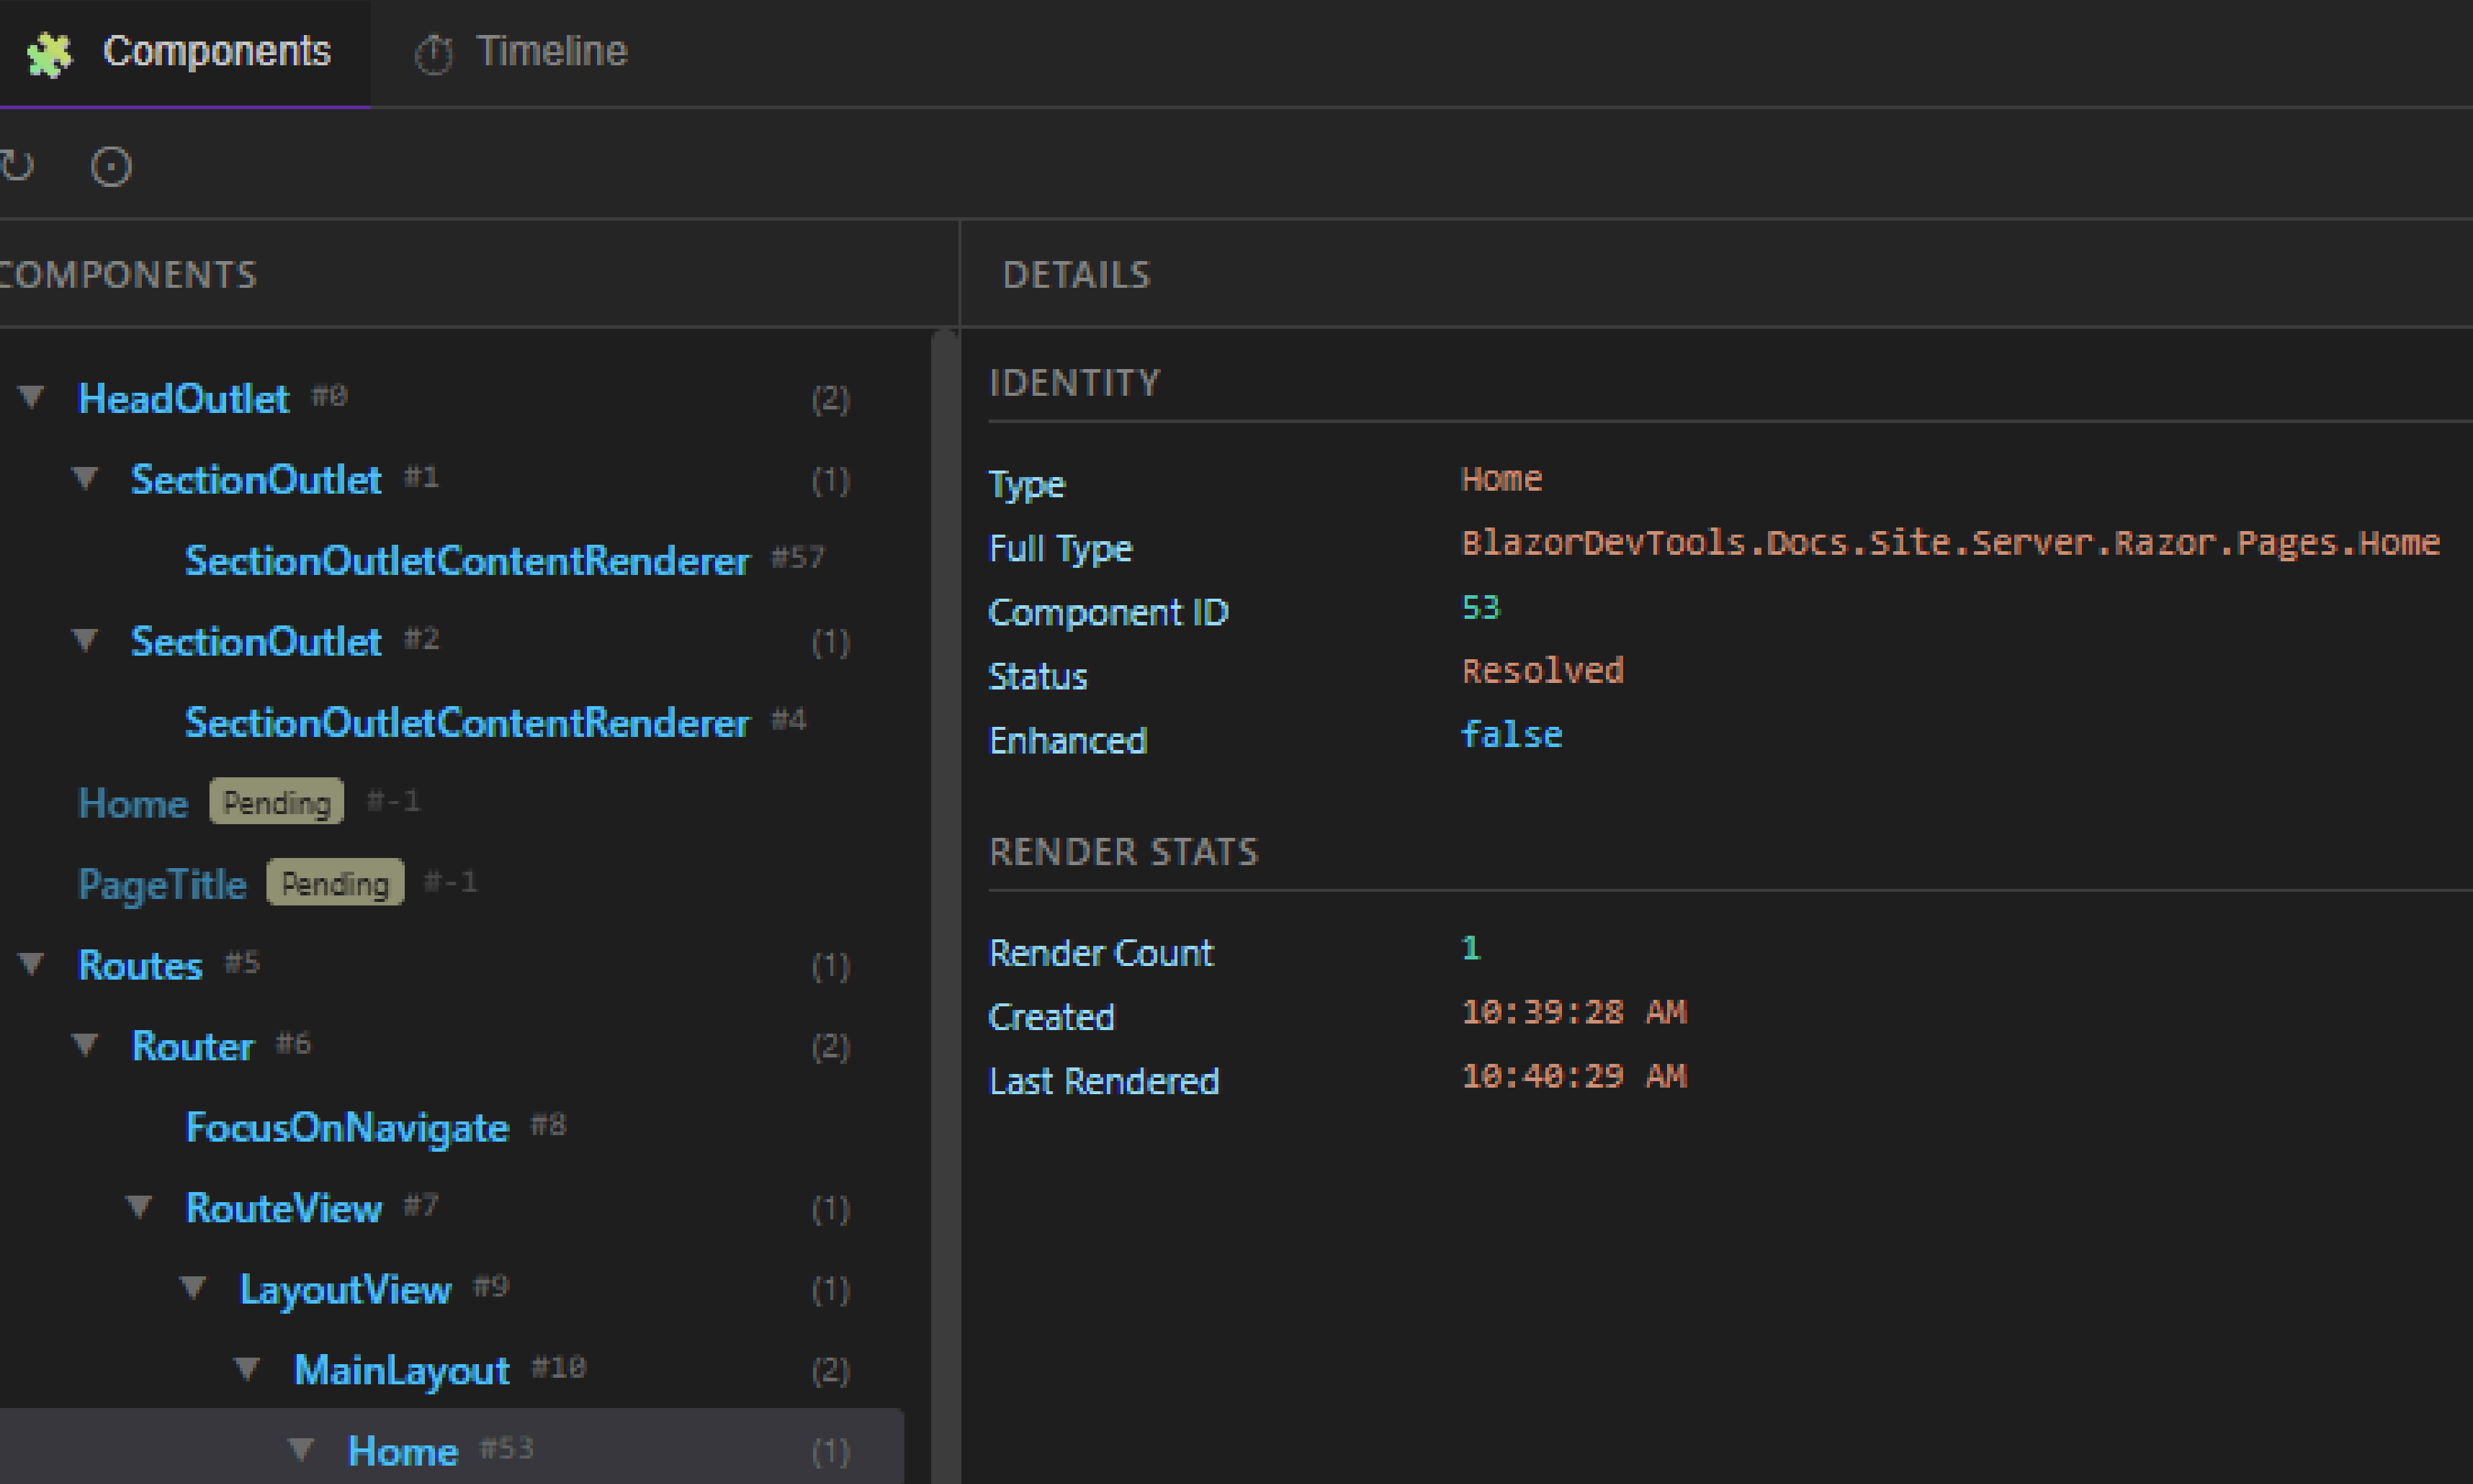
Component Tree
Visualize your entire Blazor component hierarchy. See parent-child relationships at a glance.
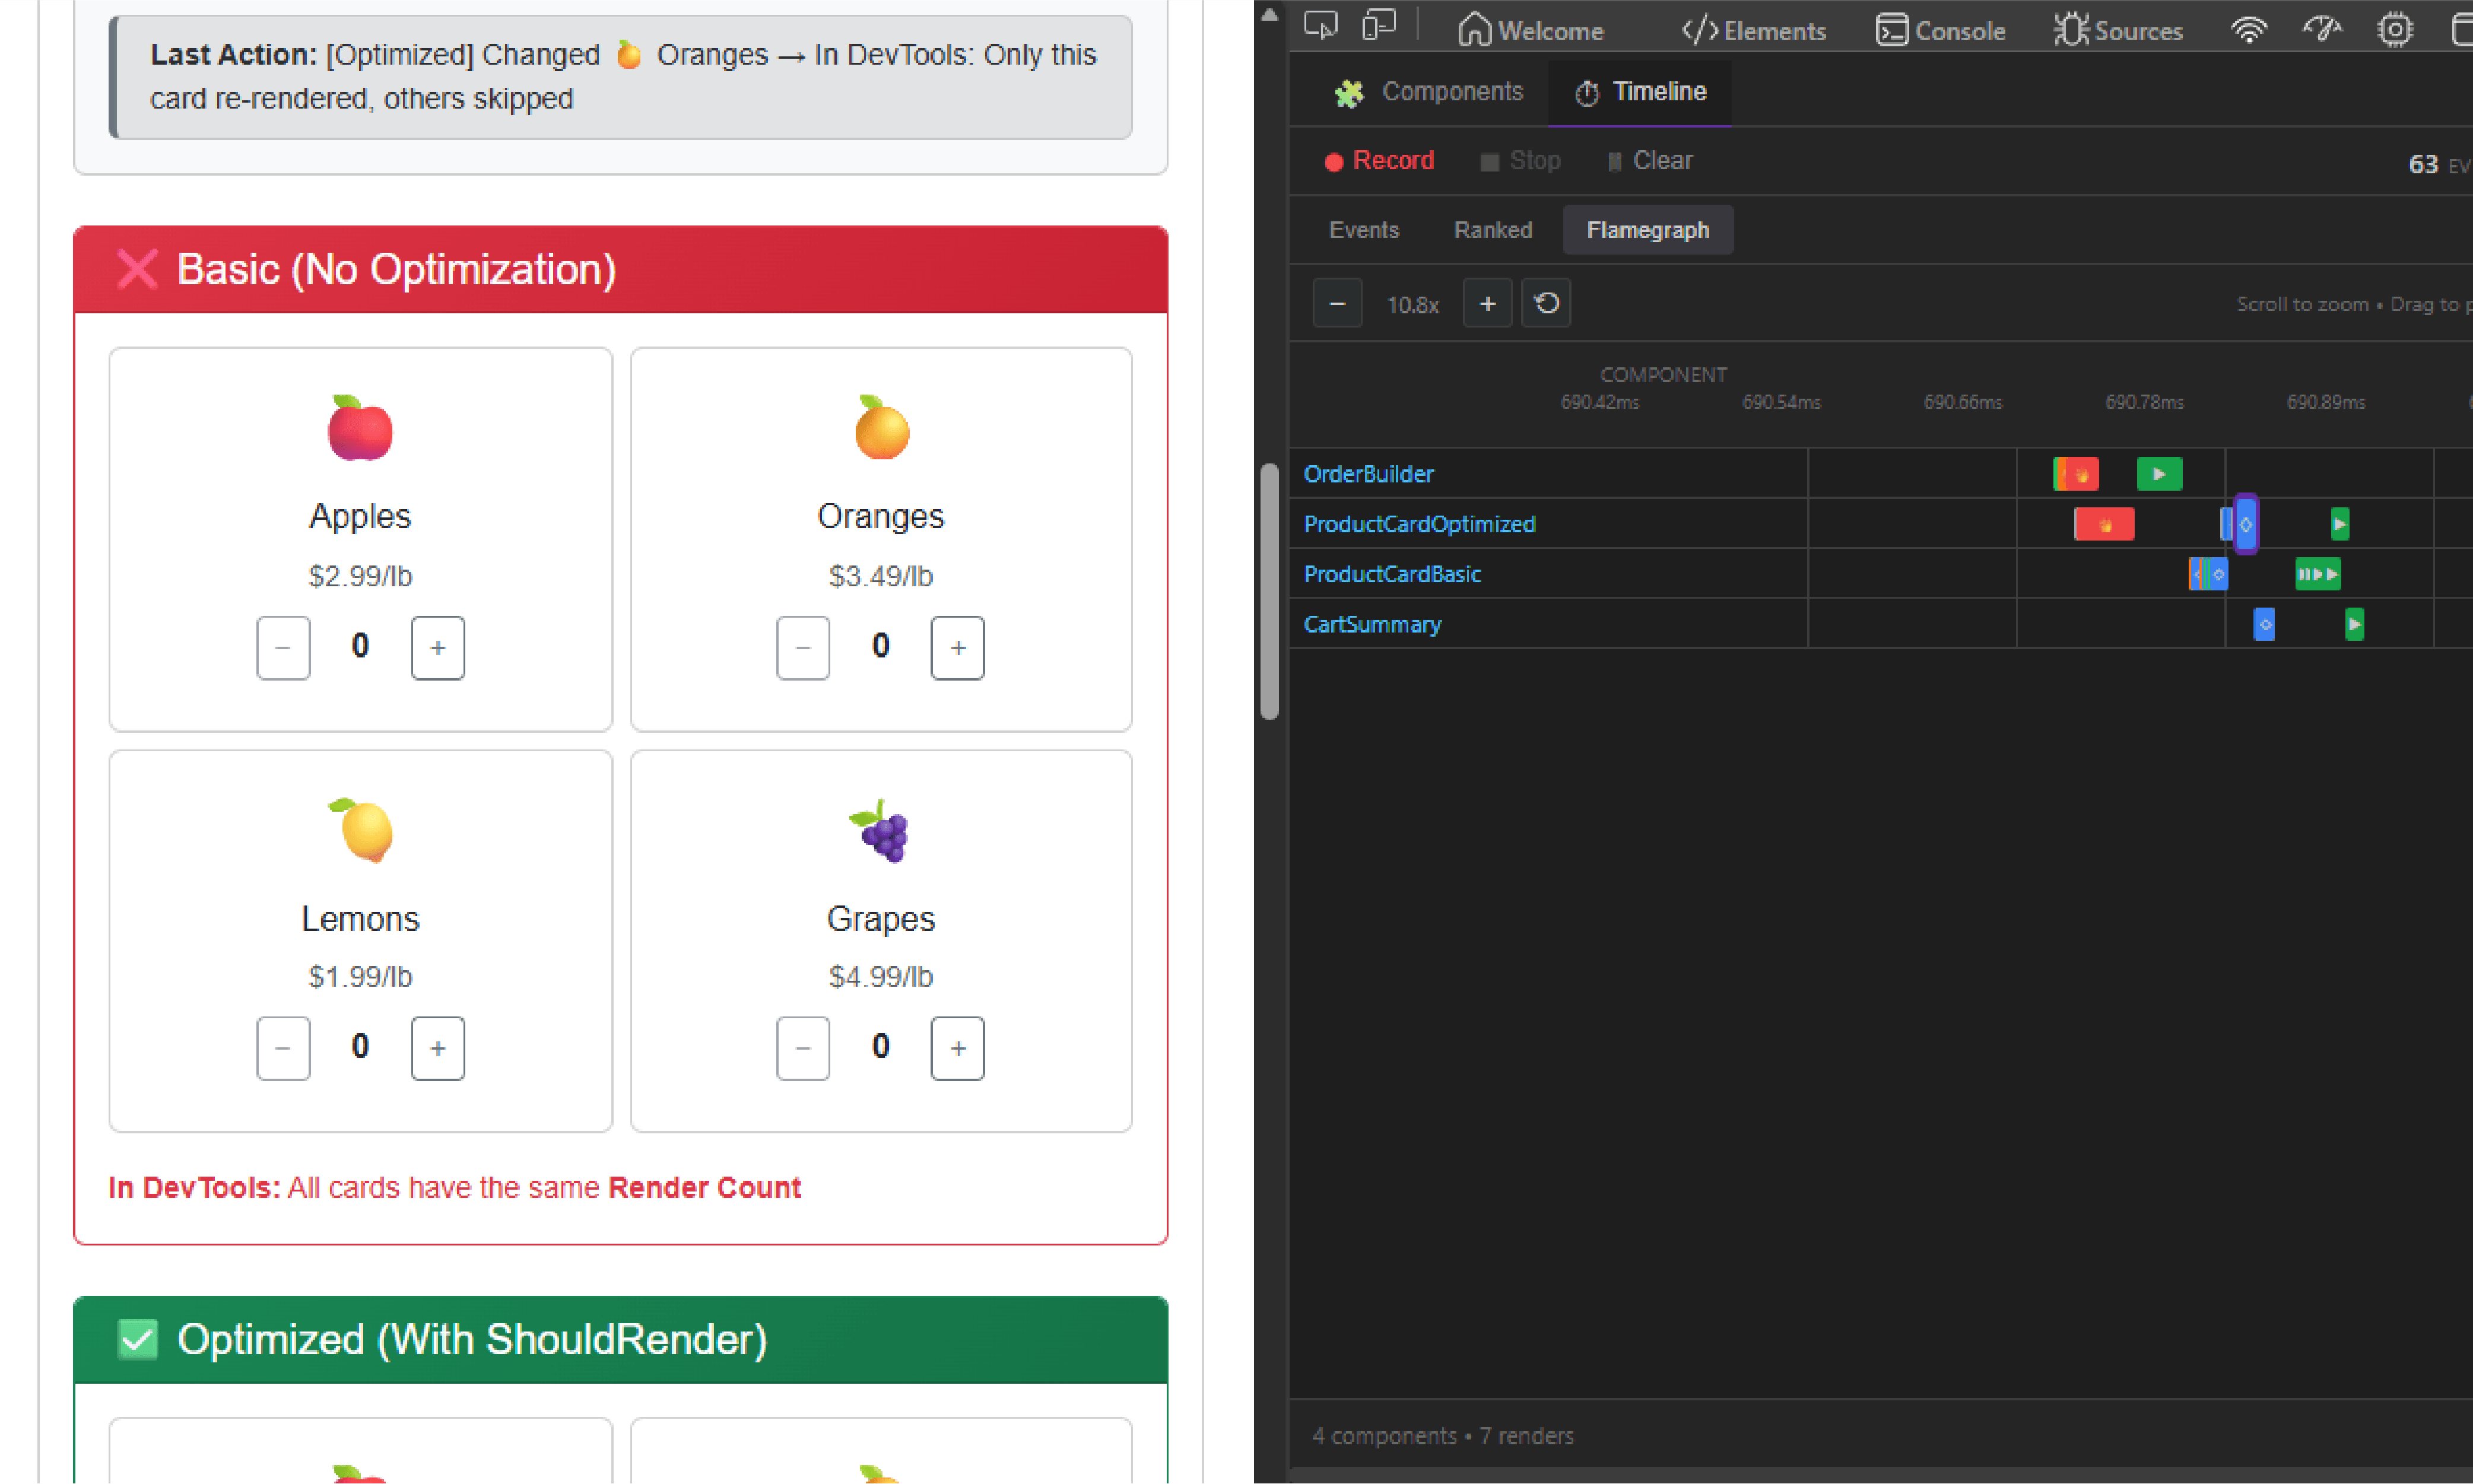
Timeline Profiler
Record and analyze component renders with a visual flamegraph. Find performance bottlenecks fast.
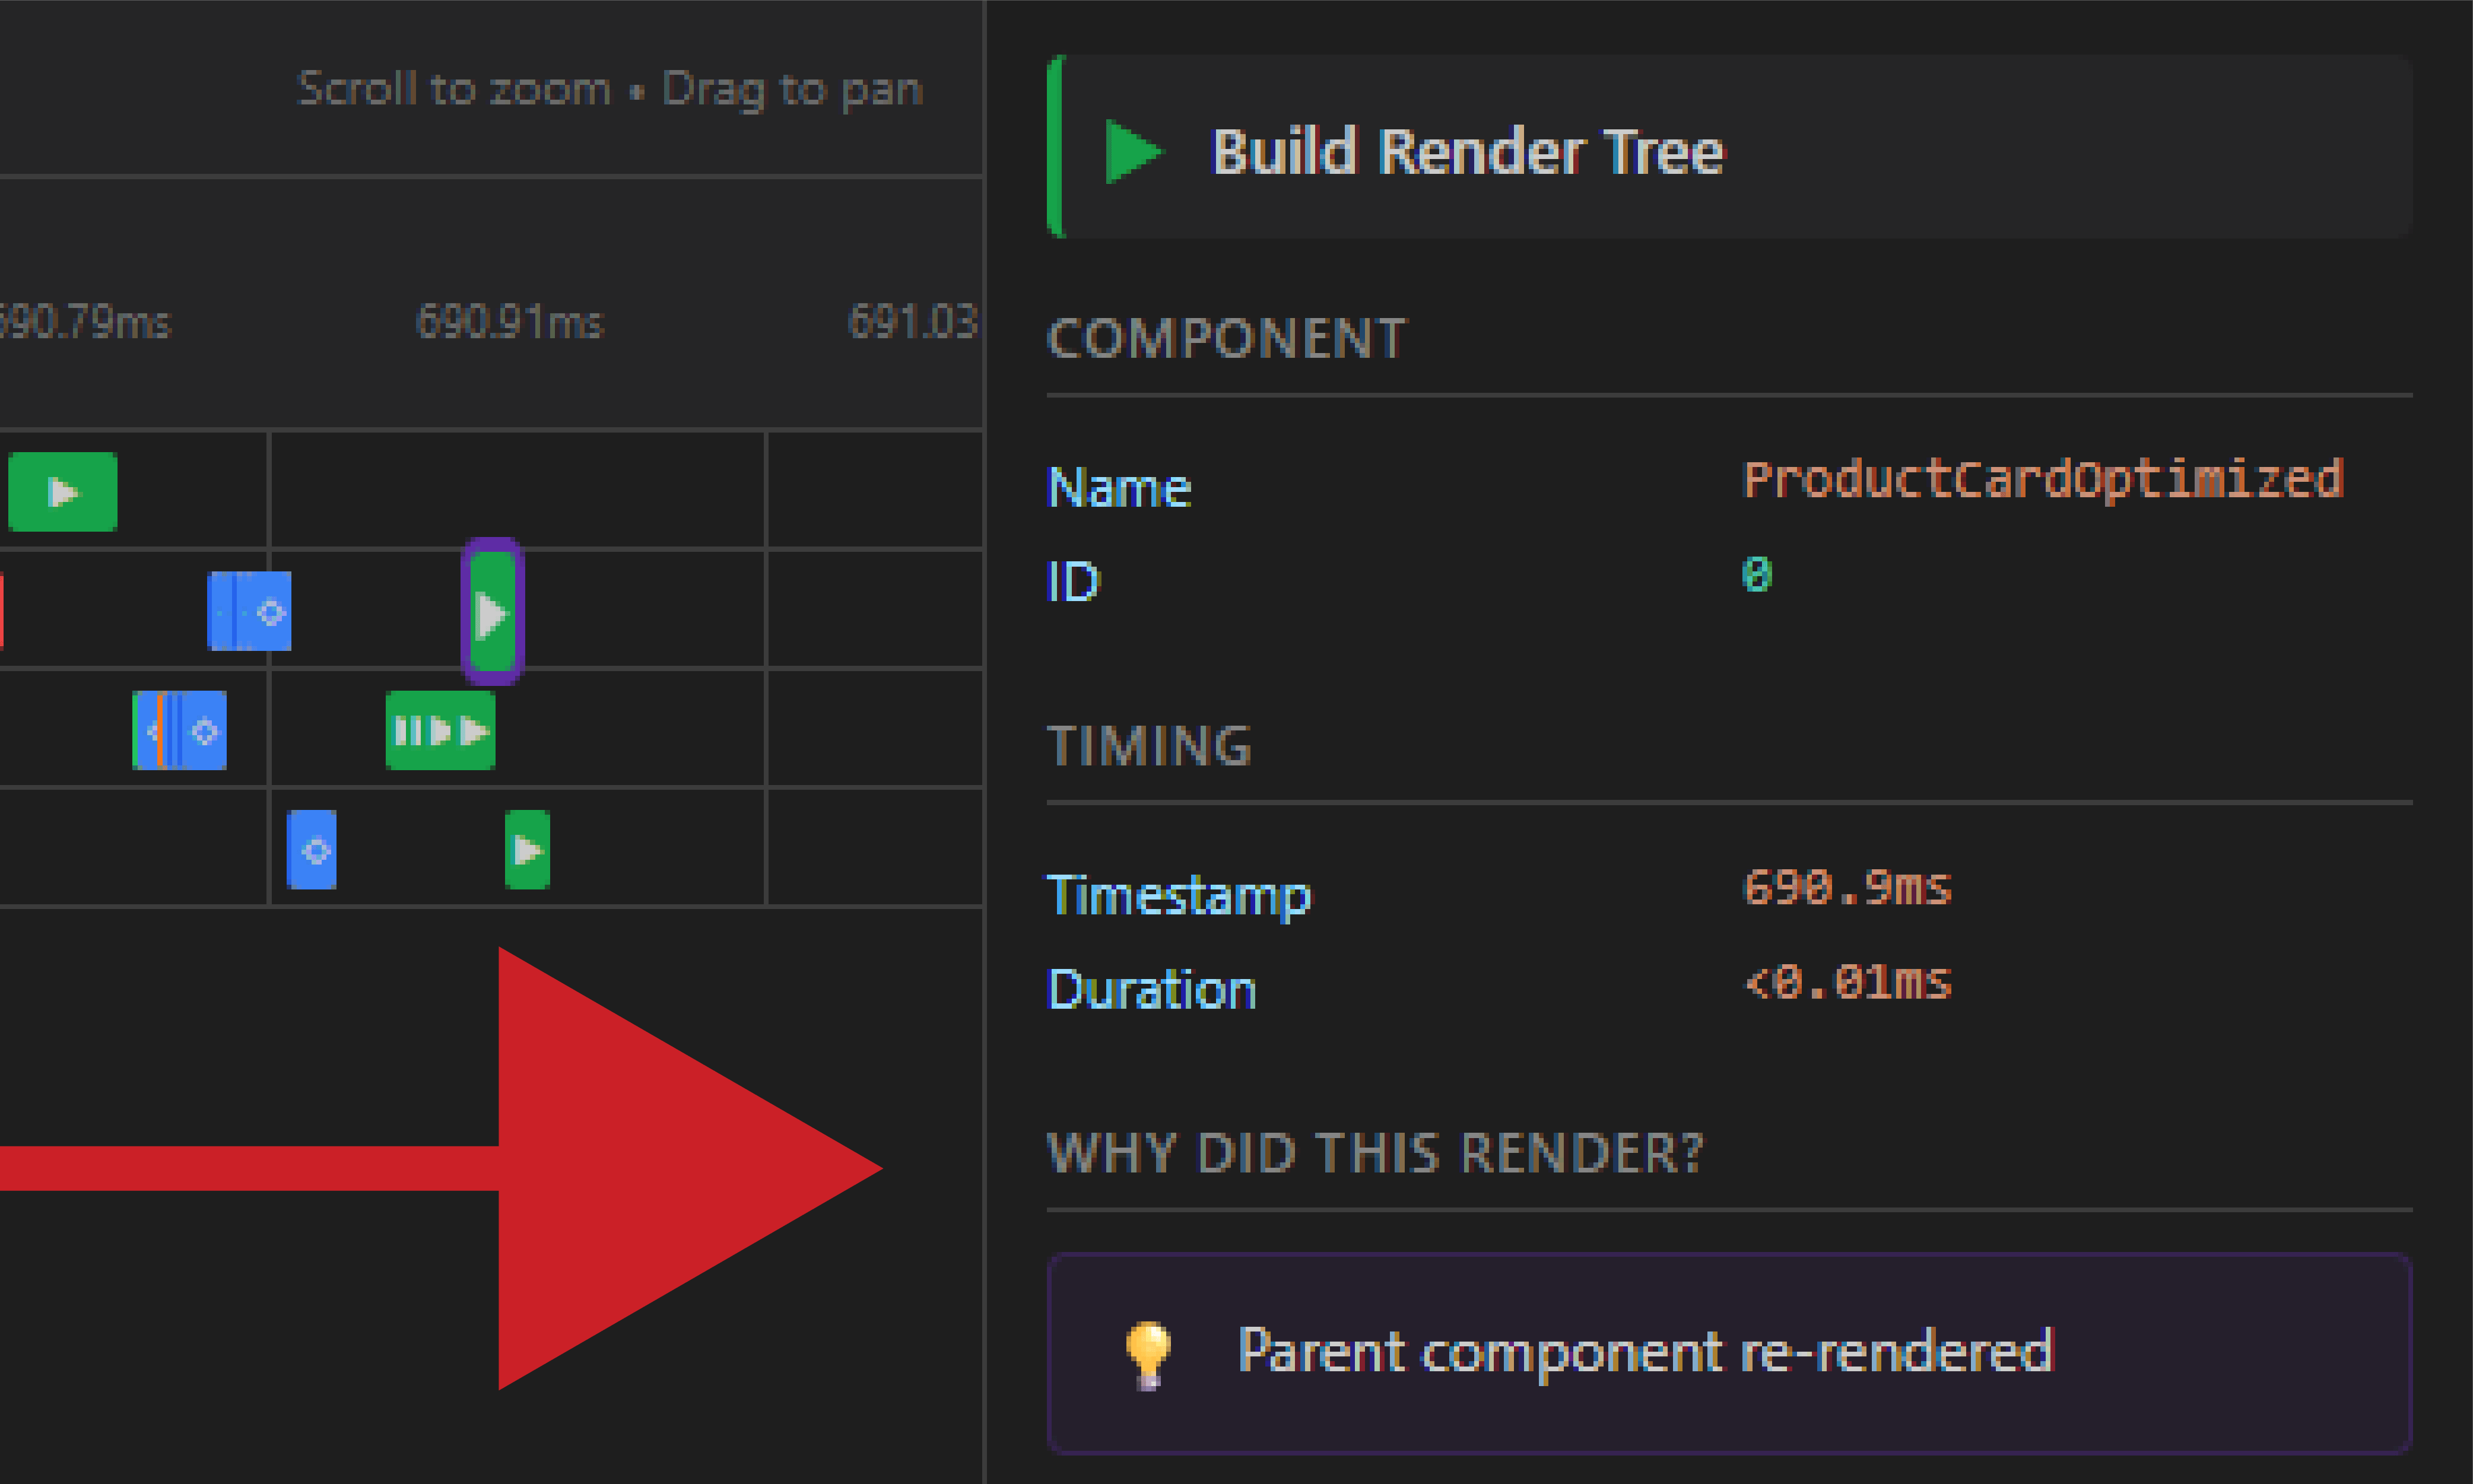
Why Did This Render?
Click any render event to see exactly what triggered it - parameters changed, StateHasChanged, events, and more.
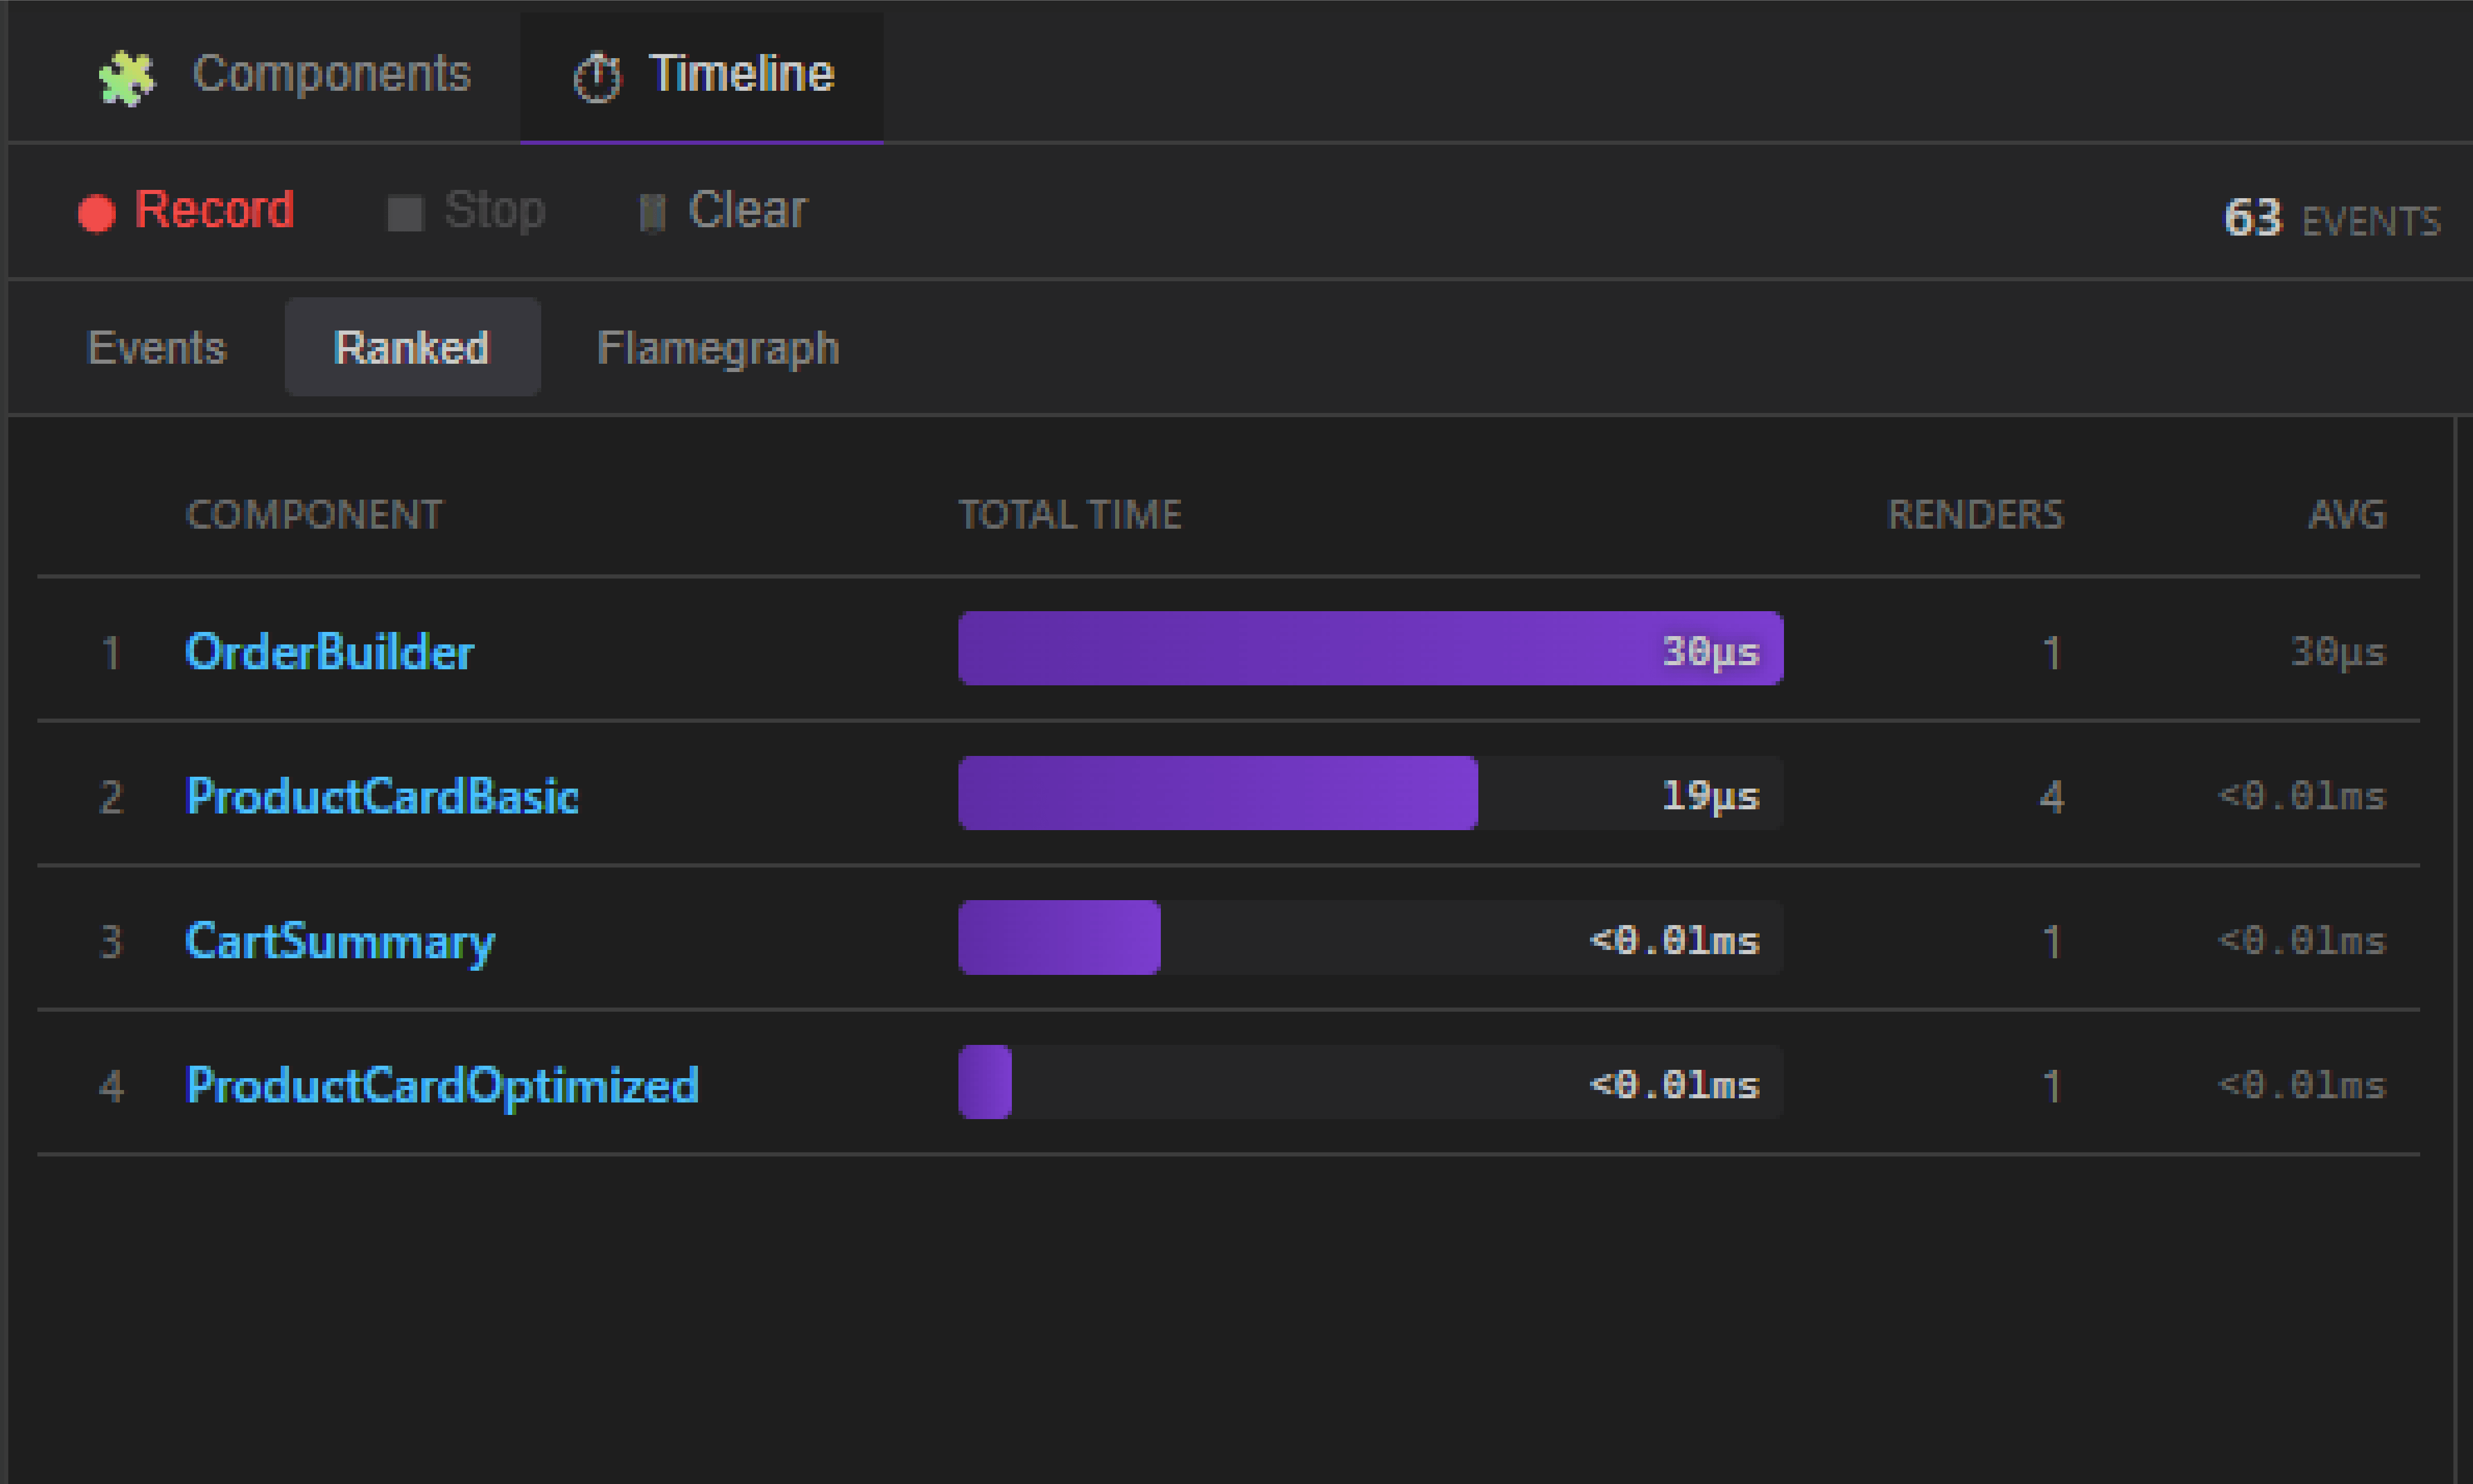
Ranked View
See which components are the slowest to render and which ones render the most often.Prioritize optimization efforts.
Works With Any Component
No code changes required for basic tracking. Works with standard ComponentBase out of the box.
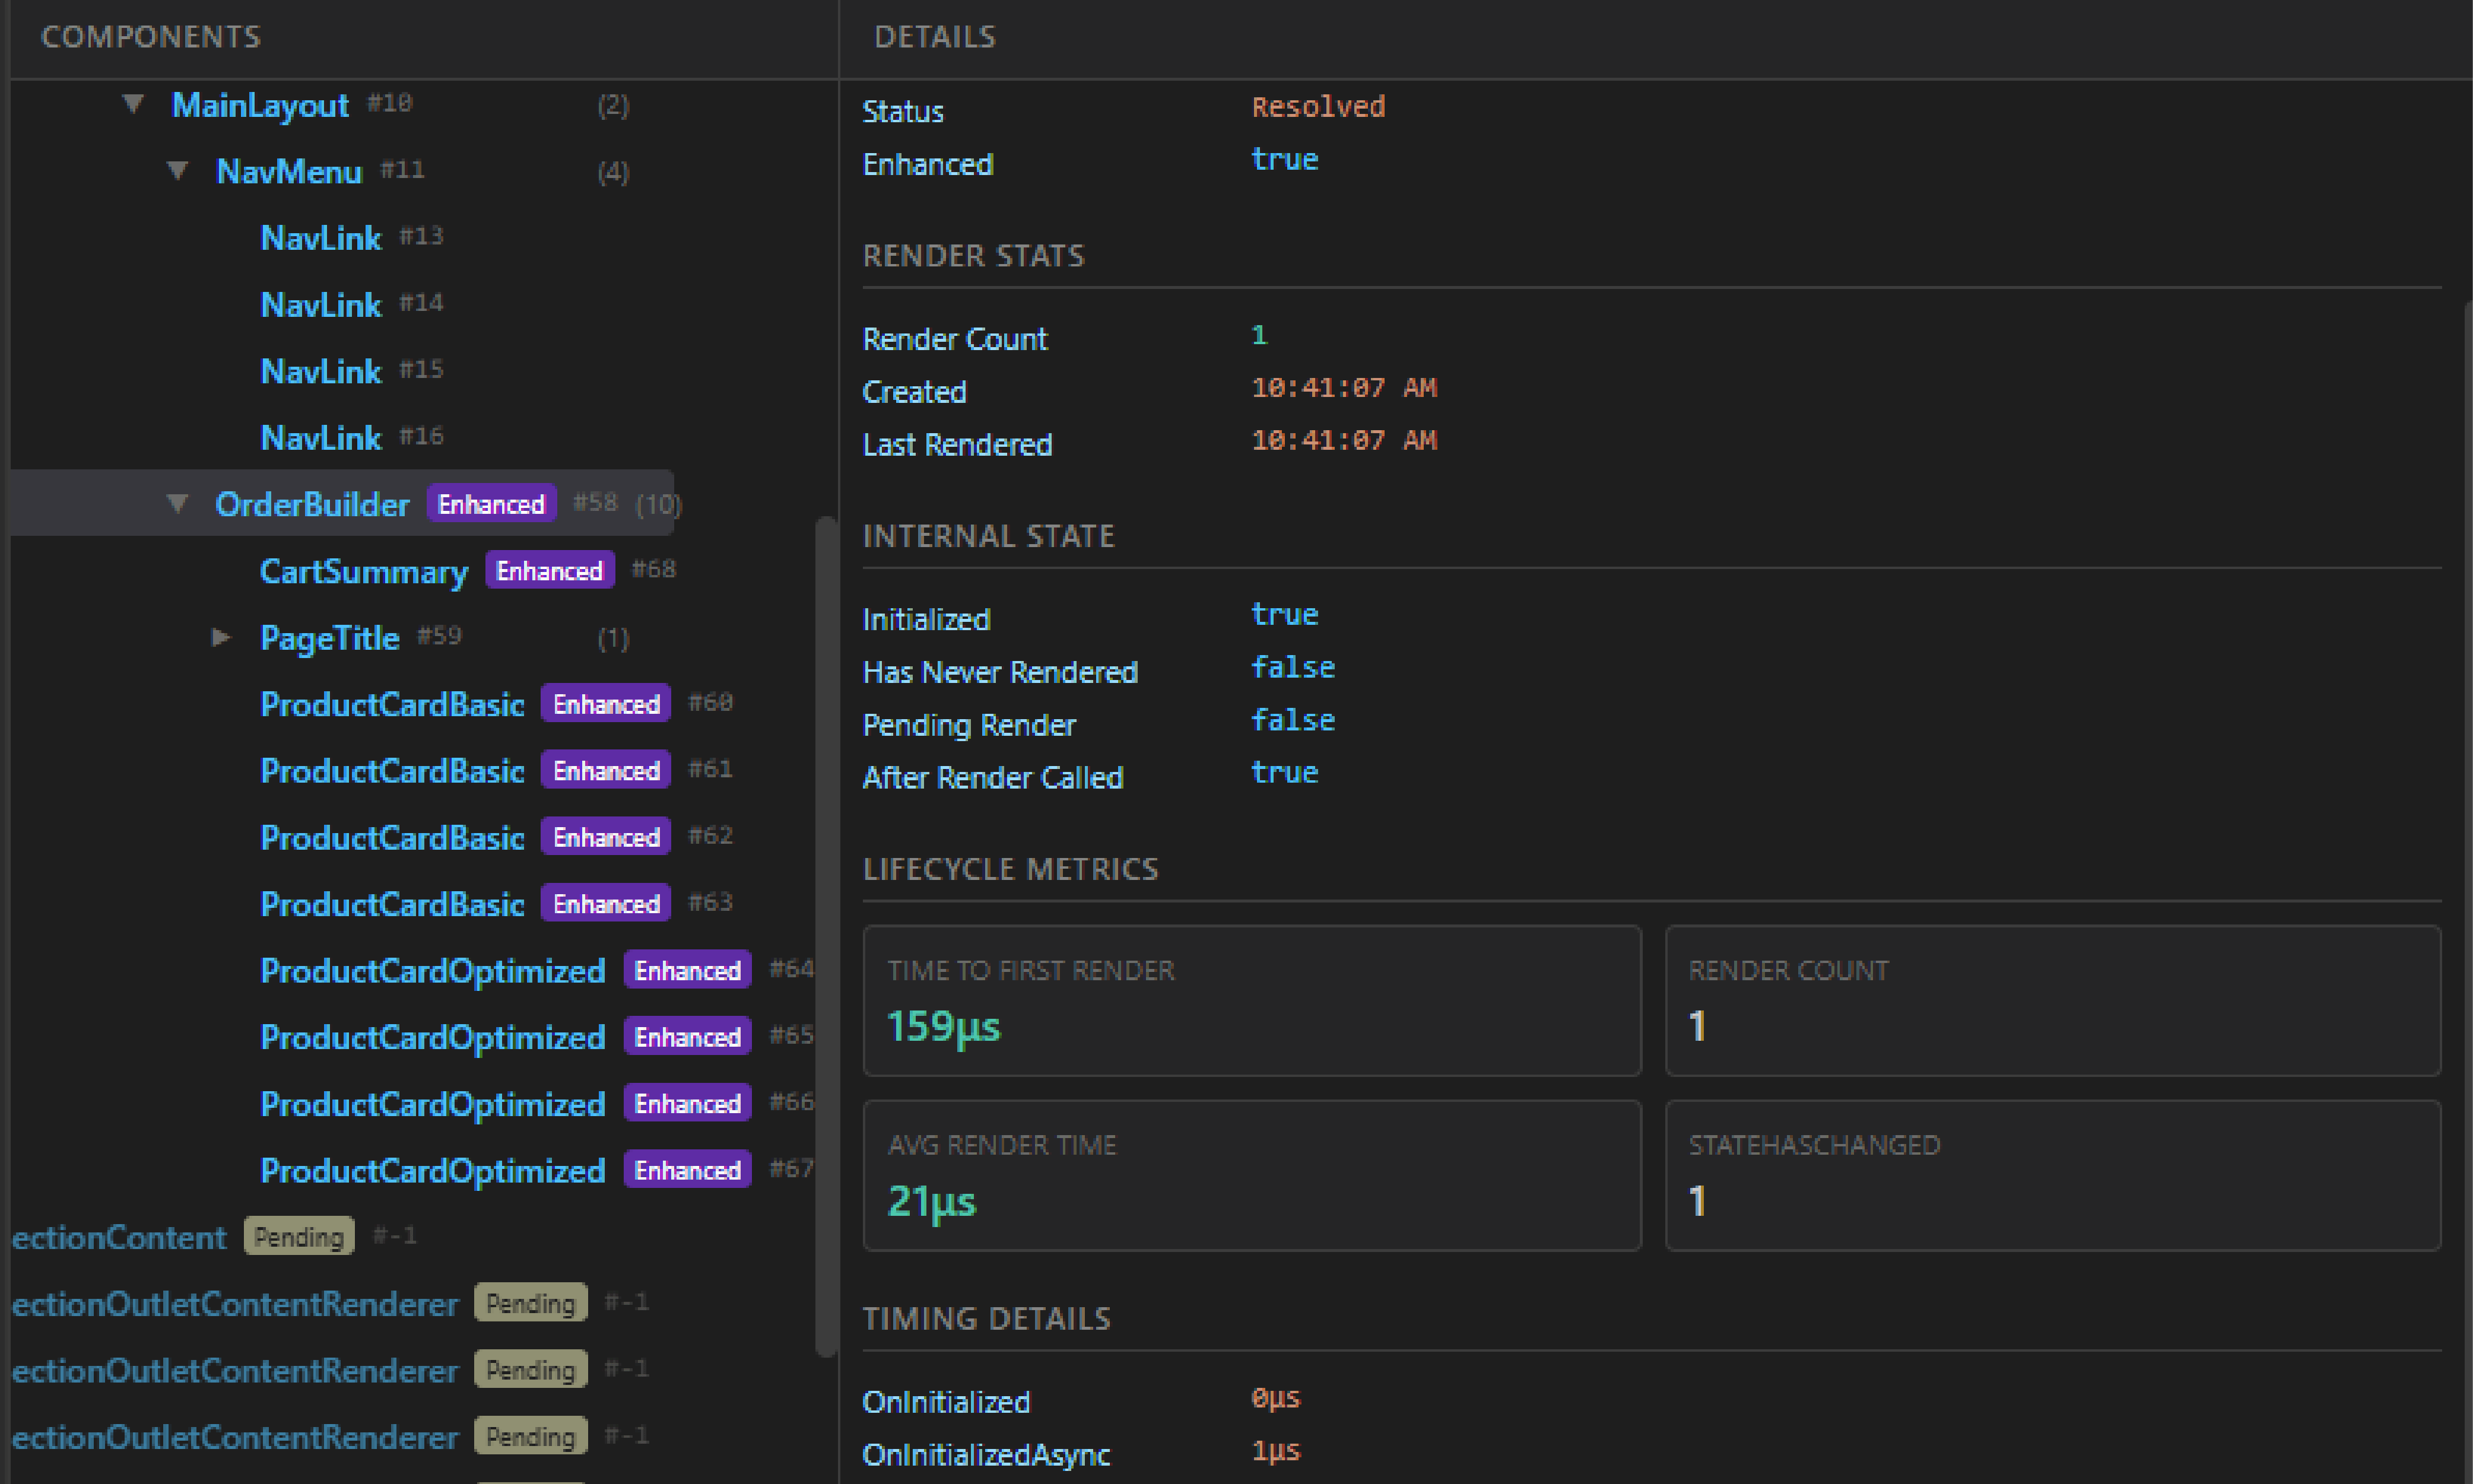
Enhanced Metrics
Opt-in to BlazorDevToolsComponentBase for deep lifecycle timing, ShouldRender tracking, and more.
How It Works
Three pillars working together for complete visibility
Component Activator
Automatic
A custom IComponentActivator intercepts every component creation, registering it in a scoped registry before the Renderer even assigns an ID. Zero configuration required.
This gives you:
✓ Automatic discovery of every component
✓ Type name and full namespace
✓ Creation timestamp
✓ Enhanced vs. standard detection
Renderer Sync
Automatic
The registry uses reflection to read the Renderer's internal component state, resolving pending components to their IDs and building the full parent-child hierarchy.
This gives you:
✓ Blazor-assigned component IDs
✓ Parent-child tree hierarchy
✓ Parameter values ([Parameter] & [CascadingParameter])
✓ Internal state (HasNeverRendered, HasPendingQueuedRender, IsInitialized)
✓ Automatic cleanup of disposed components
Enhanced Components
Opt-in
Inherit from BlazorDevToolsComponentBase for complete lifecycle instrumentation. Self-resolves via Attach() and exposes deep metrics no other tool can provide.
This gives you everything above, plus:
✓ Full lifecycle timing (OnInitialized, OnParametersSet, OnAfterRender, and async variants)
✓ BuildRenderTree duration (last, min, max, average)
✓ EventCallback timing and invocation counts
✓ StateHasChanged tracking (total calls, pending-ignored, ShouldRender-blocked)
✓ ShouldRender true/false counts and block rate %
✓ Render efficiency %, renders per minute
✓ Time to first render and component lifetime
✓ Parameter change detection
Quick Start
Get up and running in 3 simple steps
Install NuGet Package
Add to your Blazor project:
dotnet add package BlazorDeveloperToolsRegister the Service
Add this line to your Program.cs:
builder.Services.AddBlazorDevTools();Install Browser Extension
Add from Chrome Web Store or Edge Add-ons:
Want Deeper Insights?
Opt-in to enhanced tracking for detailed lifecycle metrics
Standard (automatic tracking)
@inherits ComponentBase✓ Component tree
✓ Basic render tracking
✓ Timeline events
Enhanced (opt-in)
@inherits BlazorDevToolsComponentBase✓ Everything above, plus:
✓ Lifecycle method timing
✓ ShouldRender tracking
✓ StateHasChanged counts
✓ Parameter change detection
Why Blazor Developer Tools?
Other tools require inheriting from a base class for all tracking. BDT works automatically.